BI4ALL BI4ALL
  • Expertise
    • Artificial Intelligence
    • Data Strategy & Governance
    • Data Visualisation
    • Low Code & Automation
    • Modern BI & Big Data
    • R&D Software Engineering
    • PMO, BA & UX/ UI Design
  • Knowledge Centre
    • Blog
    • Industry
    • Customer Success
    • Tech Talks
  • About Us
    • Board
    • History
    • Sustainability
    • Awards
    • Media Centre
    • Partners
  • Careers
  • Contacts
English
Português
Last Page:
    Knowledge Center
  • 3 tips for a perfect implementation of Power BI in your company

3 tips for a perfect implementation of Power BI in your company

Página Anterior: Blog
  • Knowledge Center
  • Blog
  • Fabric: nova plataforma de análise de dados
1 Junho 2023

Fabric: nova plataforma de análise de dados

Placeholder Image Alt
  • Knowledge Centre
  • 3 tips for a perfect implementation of Power BI in your company
17 June 2024

3 tips for a perfect implementation of Power BI in your company

3 tips for a perfect implementation of Power BI in your company

Key takeways

Align Power BI implementation with company objectives

Ensure your data is quality, clean and accurate

Train the team in the use of Power BI to increase the quality of reports and dashboards

Implementing Power BI in your company may seem like a daunting task, but with the right strategies, it can become a simple and effective process.

Power BI is a powerful tool that allows you to transform raw data into valuable insights, facilitating decision-making within the organisation.

So here are 3 quick tips to ensure a perfect implementation:


Tip 1: Define your goals

Before you start, it’s important to clearly define your objectives. Understanding what you want to achieve with Power BI is the first step to a successful implementation. Aligning the implementation of Power BI with your company’s specific objectives and indicators is essential to obtain relevant results.

There are many tools available that can help in defining objectives, one of them being the SWOT Matrix (Strengths, Weaknesses, Opportunities and Threats).  It is a technique used to identify strengths, weaknesses, opportunities and threats for your company, of a specific area or even project. Once you have defined what you want to improve, Power BI can be more useful in managing and influencing decision making, strengthening or targeting your organisation’s opportunities for improvement, while mitigating weaknesses and threats.

Imagine that your company wants to increase operational efficiency. Power BI can be used to monitor indicators such as production cycle time, defect rates or service response times. With this data displayed in dynamic dashboards, management can quickly identify areas for improvement and take corrective action.

Start with a clear plan. Ask yourself: what are the main problems we want to solve? What are the most important performance indicators to monitor? By having a clear vision of your goals, you can avoid feeling overwhelmed and ensure that each step of implementation is focused on achieving those specific goals.


Tip 2: Data quality matters

Make sure the data is clean and accurate. Data quality is essential to generate significant insights with Power BI. Data preparation is a critical step that directly impacts the effectiveness of the dashboards that will be created.

Power BI uses Power Query, an integrated tool that allows you to efficiently transform, cleanse, and load data. This Microsoft-developed extraction, transformation, and loading (ETL) tool is used to connect, combine, and refine data from multiple sources, enabling business users and data analysts to prepare data for analysis in an efficient manner.

The ETL process is crucial as data is extracted from multiple sources, transformed to meet analysis needs (cleaning and tuning), and loaded into Power BI for visualisation.

Imagine you’re managing a sales team and want to use Power BI to analyse sales performance. If sales data is incomplete or inaccurate, analysis and forecasts will be unreliable.

Implementing a data cleaning and validation routine is one way to ensure that sales reports are accurate and reflect market reality.

Invest time in cleaning and verifying your data before importing it into Power BI. Regular data maintenance and quality control practices are essential to ensure that reports and analyses

are reliable and useful. In short: a report is only as good as the quality of the data it uses.


Tip 3: Invest in Training

Invest in training for your team, as proper knowledge of Power BI tools and resources can significantly increase productivity and the quality of the reports and dashboards that are produced.

A marketing team, for example, can significantly benefit from training in Power BI. With in-depth knowledge, marketing analysts can create detailed reports on consumer behaviour, measure the effectiveness of advertising campaigns, and identify market trends. This allows the team to adjust its strategies in real time, increasing the return on investment (ROI) of marketing initiatives, all automatically, if the team has been adequately trained to use the reports developed in Power BI.

Equipping your team with the skills needed to use Power BI effectively is an investment that brings great returns.

Remember that Microsoft offers several training resources, from online tutorials to in-depth courses, that can help your team master the platform. A well-trained team is able to create more insightful analyses and extract maximum value from company data..


Conclusion

By following these quick tips, you can make effective use of Power BI in your organisation. By clearly defining your objectives, ensuring data quality and investing in training for your team, you will be well placed to turn data into valuable insights rand drive strategic decision-making in your organisation.


Share

Suggested Content

GenAI Agents: the new accelerator for Modern BI and Big Data projects
Blog AI & Data Science

GenAI Agents: the new accelerator for Modern BI and Big Data projects

Within Modern BI and Big Data programmes, organisations still lose enormous time on repetitive, technically heavy work: gathering requirements, mapping KPIs, designing dimensional models, generating Spark code, building Power BI models, and migrating legacy workloads. To address this, the CoE has created A Team – a family of GenAI‑powered agents designed as accelerators, not replacements, across the full lifecycle of data projects.

The Challenge of Ensuring High-Quality Power BI Semantic Models
Blog Data Visualisation

The Challenge of Ensuring High-Quality Power BI Semantic Models

As Power BI adoption grows, so does the number of semantic models, and with it, the challenge of maintaining quality and consistency. Teams working on multiple projects often adopt different approaches to naming, design, DAX, and performance, leading to models that are harder to maintain and operate efficiently.

AI Governance – From Compliance Obligation to Competitive Advantage
Blog AI & Data Science

AI Governance – From Compliance Obligation to Competitive Advantage

Most organizations know they need to govern their AI. Fewer have turned that intention into a system that regulators, auditors, and business leaders can all trust.

From Locked Data to Governed Access: GxP-Aligned Data Access for Clinical & R&D Webinar
Tech Talks Data Strategy & Data Governance

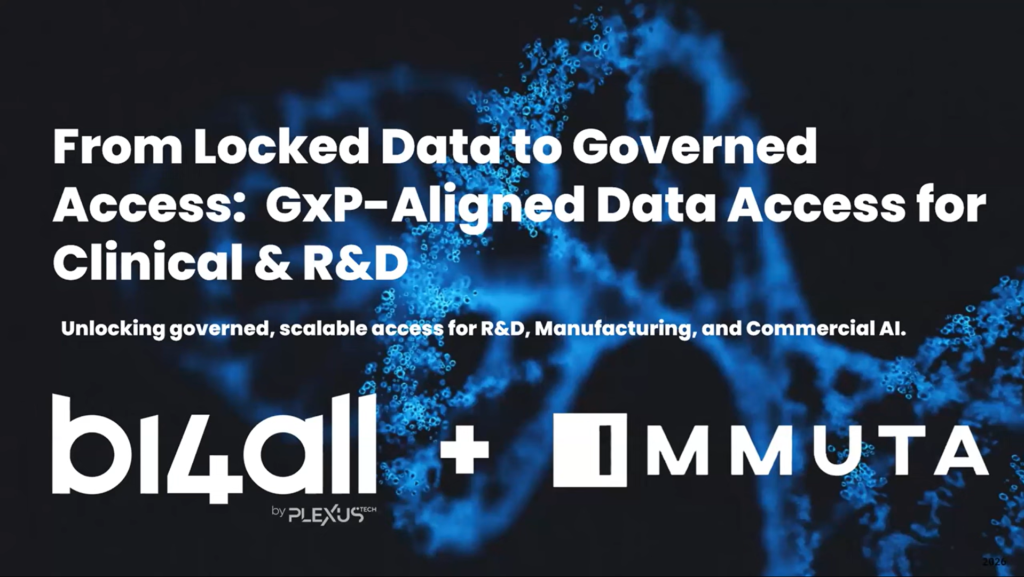
From Locked Data to Governed Access: GxP-Aligned Data Access for Clinical & R&D Webinar

In this webinar, BI4ALL and Immuta show how to scale AI in one of the world's most regulated industries without drowning in tickets, manual approvals, and access-control chaos.

The Report is Correct, the Question is Wrong
Blog Data Visualisation

The Report is Correct, the Question is Wrong

It is easy to conflate three different discussions when talking about dashboards that do not deliver: productivity driven by AI, information design, and governance over who decides what is left out. These are distinct problems with distinct solutions. Solving only one of them is not enough, which is why this article addresses them in the right order.

Inside Saint-Gobain’s Data Maturity Framework Journey with BI4ALL
Tech Talks Data Strategy & Data Governance

Inside Saint-Gobain’s Data Maturity Framework Journey with BI4ALL

In this DAMA Portugal (Lisbon Chapter) webinar, Orquídea Fonseca (Data Strategy Lead, Saint-Gobain) and Sandro Scordo (Head of Data & AI Strategy and Governance, BI4ALL) share the story behind building an enterprise data maturity assessment across a decentralised, 80-country organisation.

video title

Lets Start

Got a question? Want to start a new project?
Contact us

Menu

  • Expertise
  • Knowledge Centre
  • About Us
  • Careers
  • Contacts

Newsletter

Keep up to date and drive success with innovation
Newsletter
PRR - Plano de Recuperação e Resiliência. Financiado pela União Europeia - NextGenerationEU

2026 All rights reserved

Privacy and Data Protection Policy Information Security Policy
URS - ISO 27001
URS - ISO 27701
Cookies Settings

BI4ALL may use cookies to memorise your login data, collect statistics to optimise the functionality of the website and to carry out marketing actions based on your interests.
You can customise the cookies used in .

Cookies options

These cookies are essential to provide services available on our website and to enable you to use certain features on our website. Without these cookies, we cannot provide certain services on our website.

These cookies are used to provide a more personalised experience on our website and to remember the choices you make when using our website.

These cookies are used to recognise visitors when they return to our website. This enables us to personalise the content of the website for you, greet you by name and remember your preferences (for example, your choice of language or region).

These cookies are used to protect the security of our website and your data. This includes cookies that are used to enable you to log into secure areas of our website.

These cookies are used to collect information to analyse traffic on our website and understand how visitors are using our website. For example, these cookies can measure factors such as time spent on the website or pages visited, which will allow us to understand how we can improve our website for users. The information collected through these measurement and performance cookies does not identify any individual visitor.

These cookies are used to deliver advertisements that are more relevant to you and your interests. They are also used to limit the number of times you see an advertisement and to help measure the effectiveness of an advertising campaign. They may be placed by us or by third parties with our permission. They remember that you have visited a website and this information is shared with other organisations, such as advertisers.

Política de Privacidade