BI4ALL BI4ALL
  • Expertise
    • Artificial Intelligence
    • Data Strategy & Governance
    • Data Visualisation
    • Low Code & Automation
    • Modern BI & Big Data
    • R&D Software Engineering
    • PMO, BA & UX/ UI Design
  • Knowledge Centre
    • Blog
    • Industry
    • Customer Success
    • Tech Talks
  • About Us
    • Board
    • History
    • Sustainability
    • Awards
    • Media Centre
    • Partners
  • Careers
  • Contacts
English
Português
Last Page:
    Knowledge Center
  • The Power BI Model is ready, but what about the documentation?

The Power BI Model is ready, but what about the documentation?

Página Anterior: Blog
  • Knowledge Center
  • Blog
  • Fabric: nova plataforma de análise de dados
1 Junho 2023

Fabric: nova plataforma de análise de dados

Placeholder Image Alt
  • Knowledge Centre
  • The Power BI Model is ready, but what about the documentation?
20 May 2025

The Power BI Model is ready, but what about the documentation?

The Power BI Model is ready, but what about the documentation?

Key takeways

Documenting Power BI models ensures maintainability, trust, and user adoption.

INFO.VIEW functions enable dynamic, automated documentation.

This approach brings immediate benefits like clarity, speed, and greater user autonomy.

Companies demand fast deliveries and increasingly sophisticated dashboards, so documentation is often overlooked. But neglecting this step can compromise scalability, maintenance and even the reliability of analyses.

With regard to Power BI models – which structure data and define business rules through reports – documenting is just as strategic as developing. In this article, we show why documentation should be an integral part of any Power BI project and how it makes a difference to long-term success.

Documentation in technological projects is therefore essential to guarantee efficiency, quality and project continuity. In the case of Power BI semantic models, this is no exception.


Why should we document our models?

Documenting models in Power BI is not only good practice, it’s also an operational necessity.

We can list several reasons, but we identify the following as the most crucial:

  • Easier to understand:

Detailed documentation helps users understand how the model works, including the transformations made, calculations and relationships between the data.

  • Promotes consistency: 

With clear documentation, the whole team can follow the same rules when creating templates and reports, ensuring that the results are consistent.

  • Supports maintenance:

Well-documented models are easier to maintain, modify or update, as the documentation serves as a guide to how the data is interconnected.

  • Favours collaboration:

Documentation allows different teams or users to collaborate effectively, sharing and reusing models, so that less time is wasted trying to understand the logic of the models themselves.

  • Improves data quality:

Documenting how models are built and what calculations are applied helps to ensure that the data presented in reports is accurate, reliable and transparent.


Increasingly, documentation is a vital component for the success of any model or report. How many times have your users questioned the metrics in your reports? Or how many times have you felt that your users simply don’t know your models, making it difficult to adopt self-service BI practices? And how many times have you inherited a model without any documentation associated with what was developed, not explaining what was done and why?

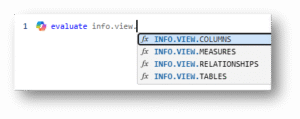
In October 2024, Microsoft launched a set of new features in its monthly update: the INFO.VIEW functions. These functions allow you to obtain metadata directly from your model, opening the door to a dynamic self-documentation approach.

Using these functions to create calculated tables in the model itself ensures that the documentation keeps track of all the changes made: adding new tables, changing relationships, creating measures, calculated columns, and so on. Everything is automatically reflected after each refresh.
 

How have the INFO.VIEW functions been applied?

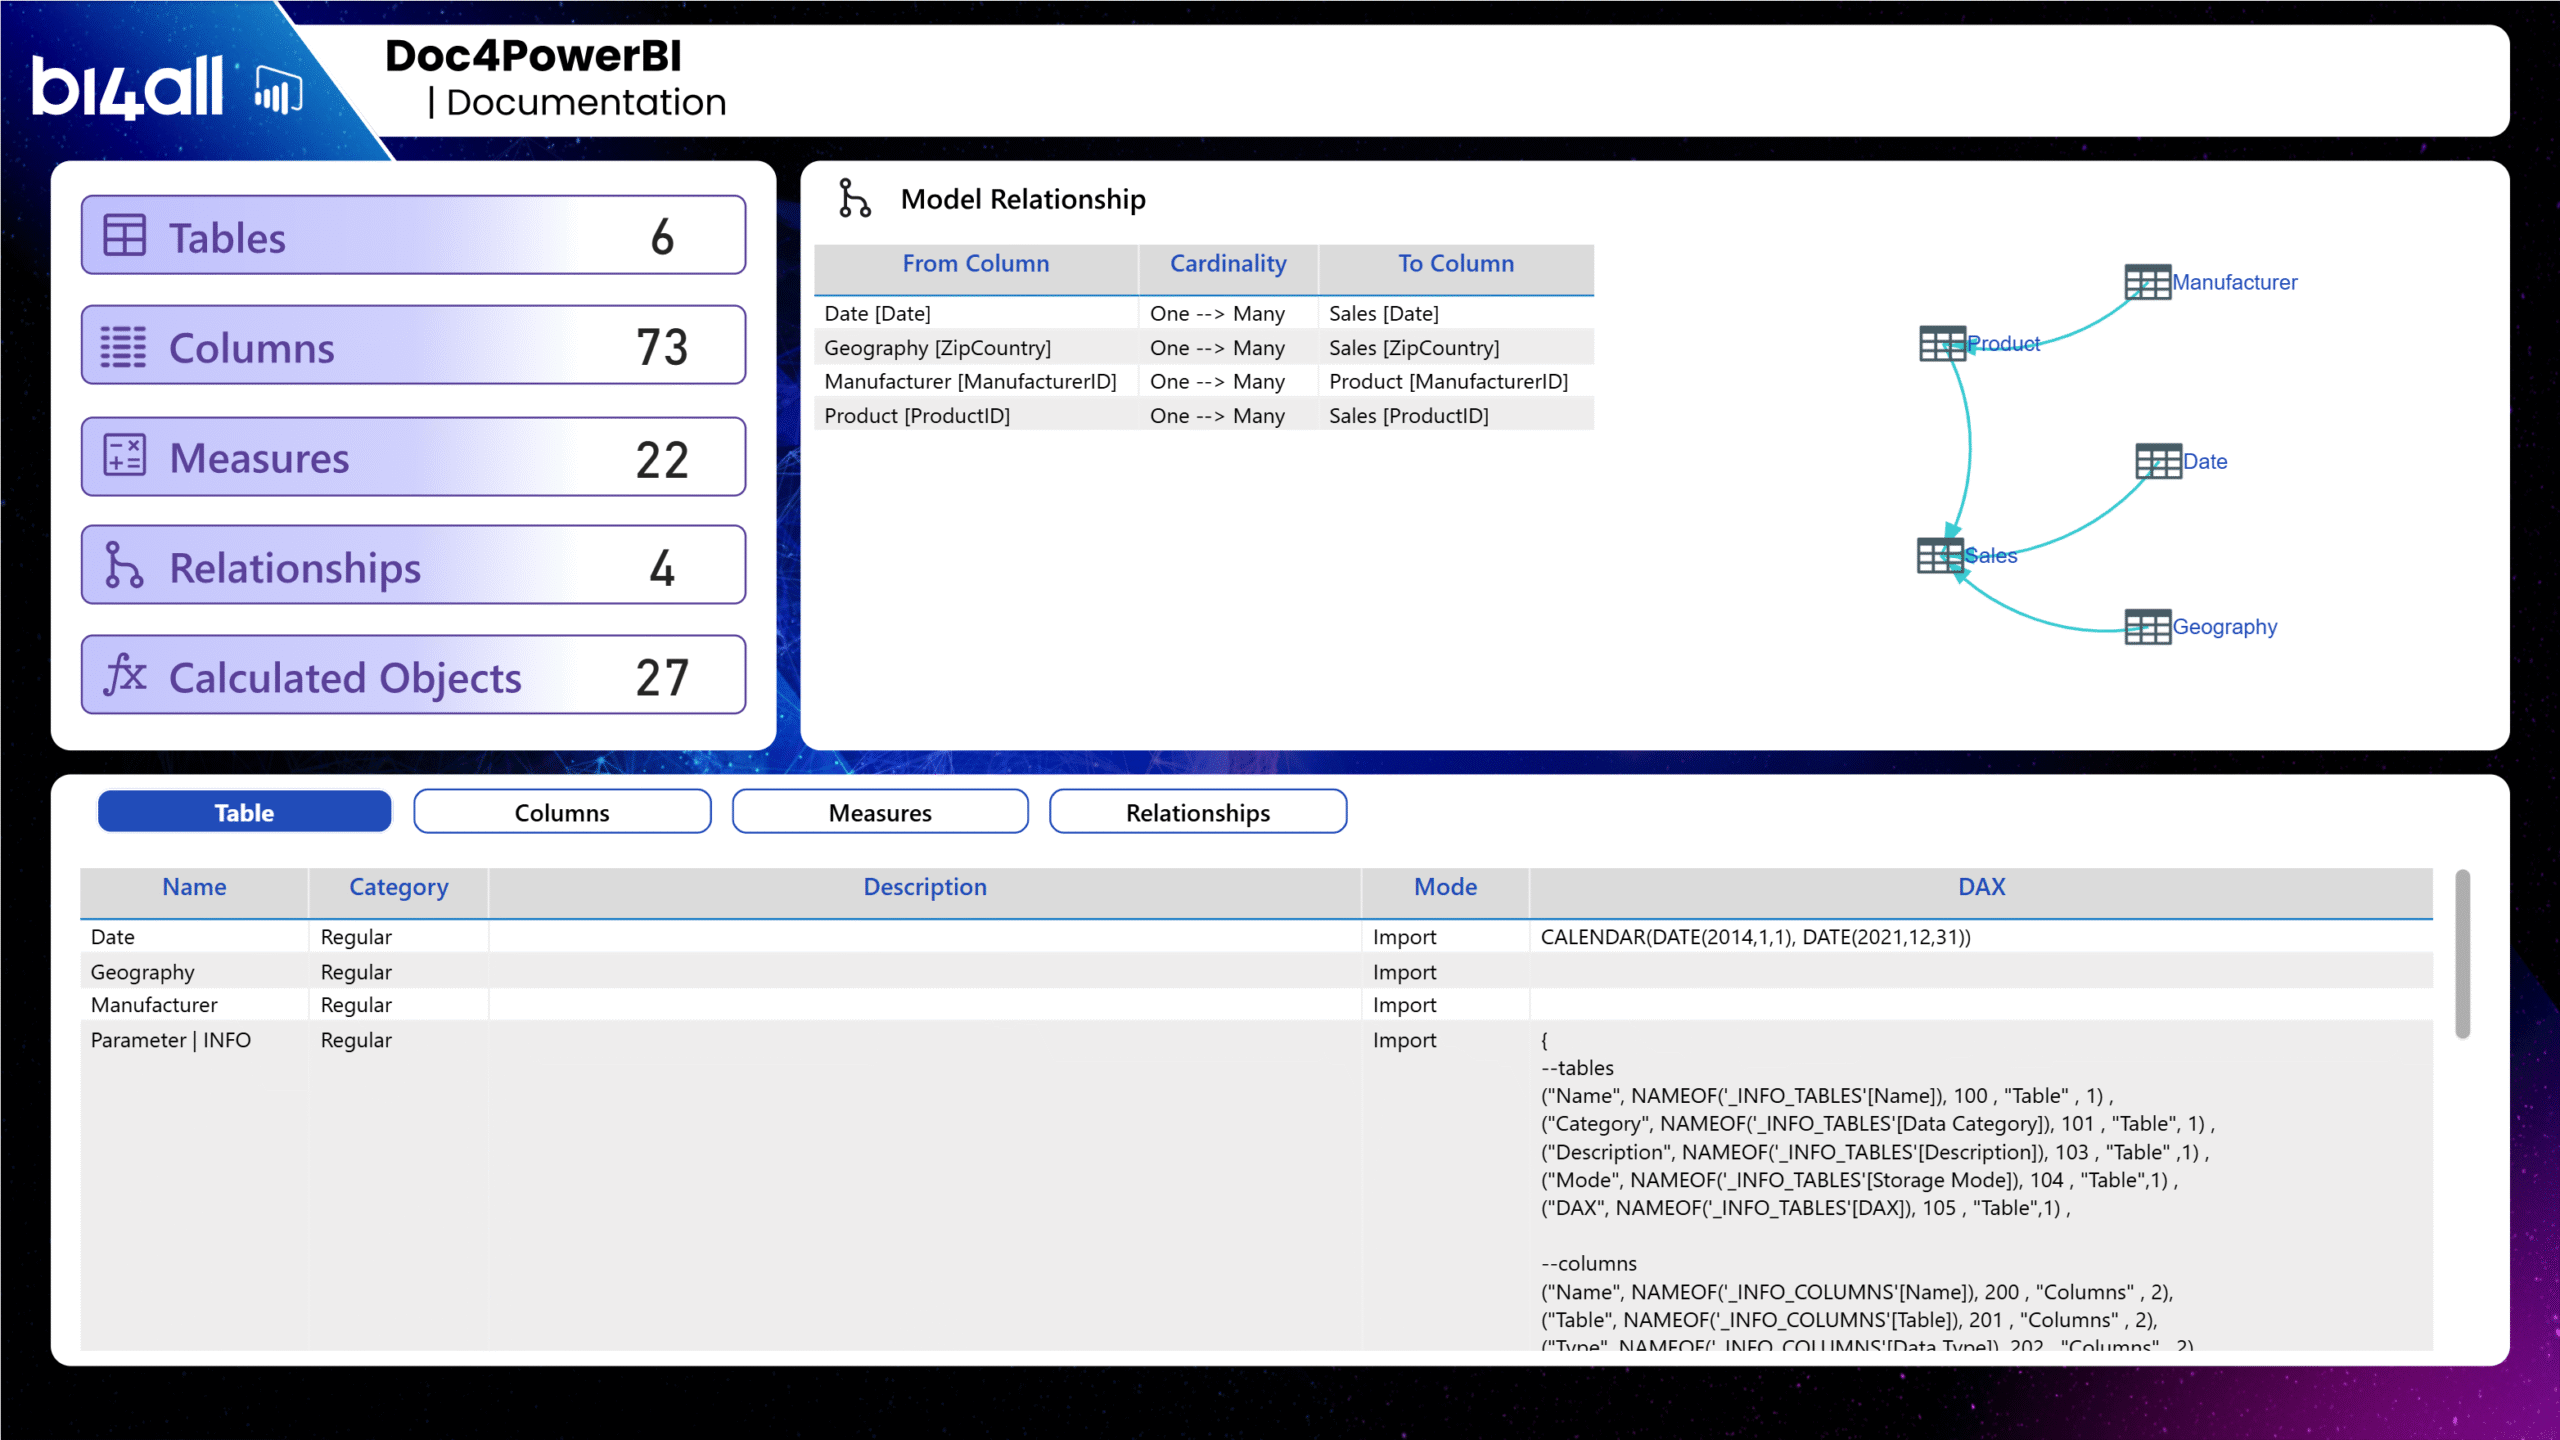
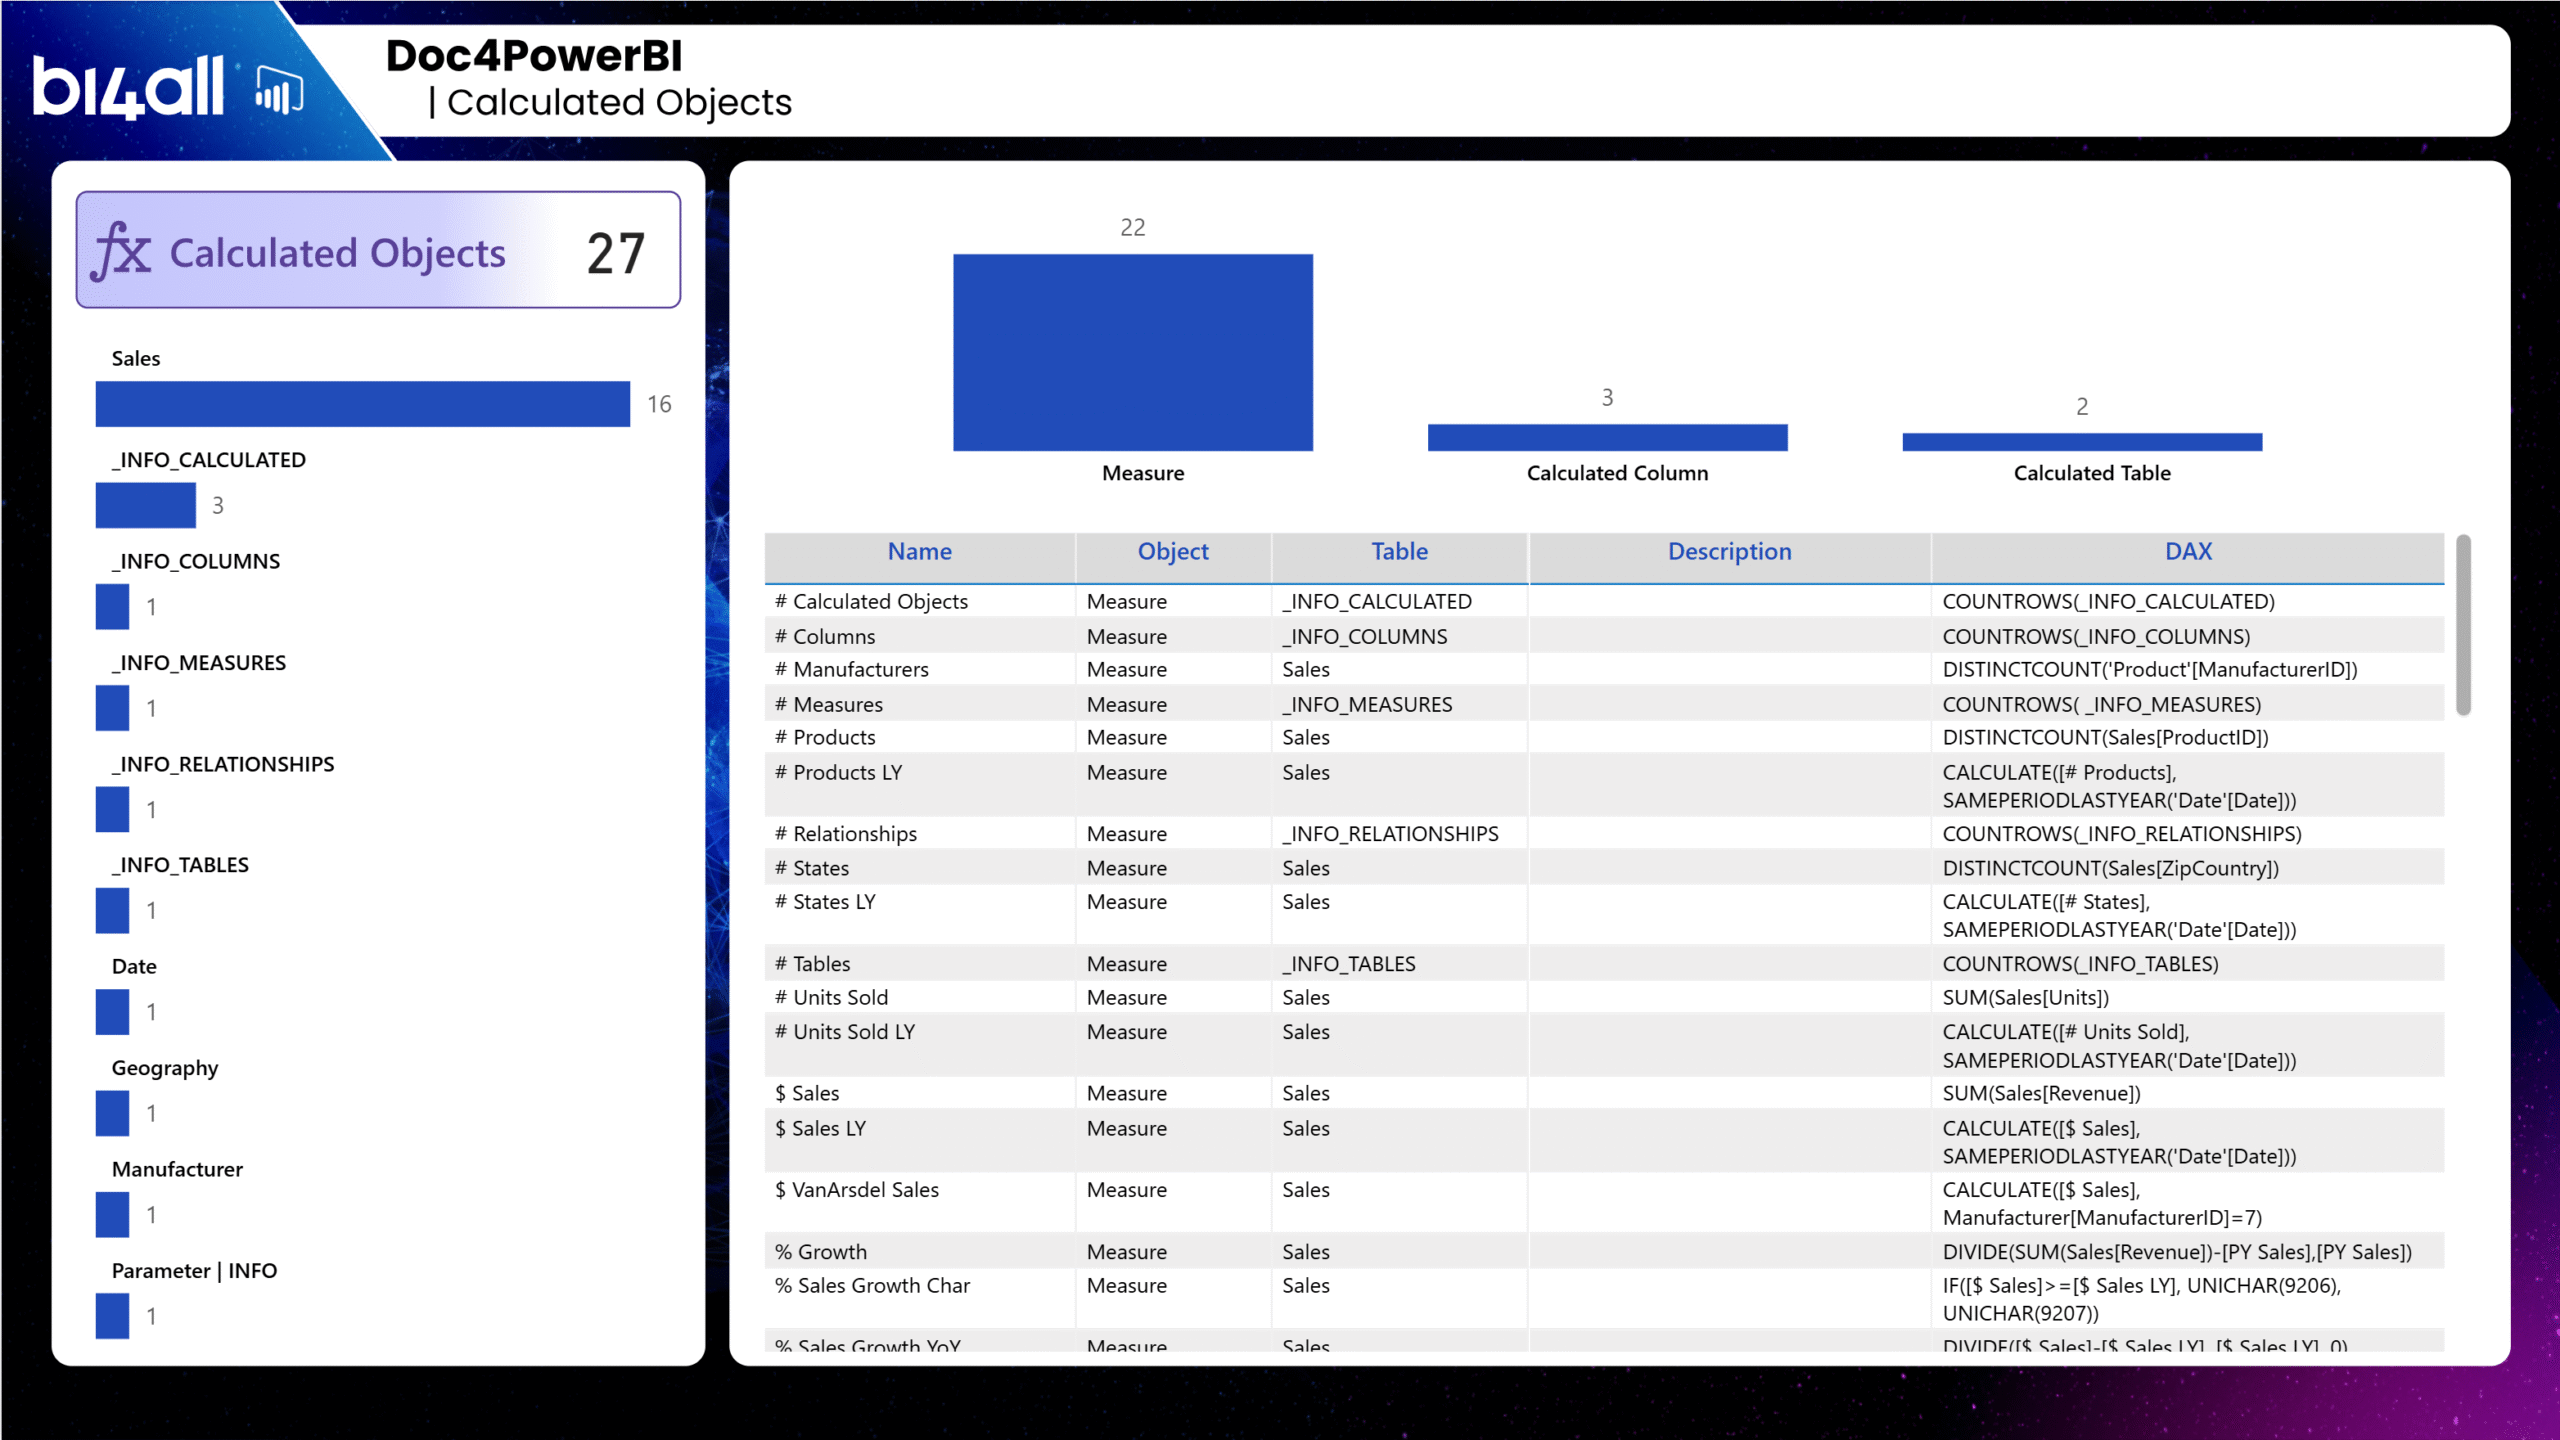
With this recurring challenge in mind, BI4ALL’s Power BI team has exploited these functions to create a simple and effective process for implementing an automatic documentation solution, allowing the main information on the following elements to be visualised clearly and immediately:

  • Tables
  • Columns
  • Metrics
  • Relationships
  • Calculated objects

This way we can take any Power BI semantic model and quickly present a 2-page output with the main details of the model.
Placeholder Image Alt

Key benefits

Adopting this approach brings immediate and long-term gains:

  • Fast implementation:

Easy to apply the solution to any Power BI model

  • Detail in the information presented:

The details that the model provides are relevant for users to understand the model

  • Personalisation:

The layout can be easily adapted to each client’s visual identity

  • Continuous updating:

Any changes to the template will be automatically documented in the next refresh.

  • Transparency and trust:

All users can see the details of the models and thus understand them better. By making the details of the models visible to all users, they can have a better understanding and greater confidence in the data, while also promoting more autonomous use of the tool.


Conclusion

To summarise, documentation in IT projects, especially in Power BI semantic models, is not just an optional step: it is an essential component for guaranteeing the efficiency, quality and continuity of projects. It is through documentation that we can promote understanding, consistency, maintenance, collaboration and the quality of data and models.

With INFO.VIEW’s functionalities, it is possible to have continuous, up-to-date self-documentation of the main elements of a model. This makes it possible to implement a fast, detailed, customised and transparent solution, benefiting all users and creating a more efficient and collaborative working environment.

By implementing this solution, we are taking an important step towards a more robust, accessible and reliable data ecosystem.


 

References:

https://learn.microsoft.com/en-us/dax/info-functions-dax

https://powerbi.microsoft.com/en-us/blog/power-bi-october-2024-feature-summary/#post-28196-_Toc179458536

Author

Bruno Miguel Costa

Bruno Miguel Costa

Associate Specialist

Share

Suggested Content

GenAI Agents: the new accelerator for Modern BI and Big Data projects
Blog AI & Data Science

GenAI Agents: the new accelerator for Modern BI and Big Data projects

Within Modern BI and Big Data programmes, organisations still lose enormous time on repetitive, technically heavy work: gathering requirements, mapping KPIs, designing dimensional models, generating Spark code, building Power BI models, and migrating legacy workloads. To address this, the CoE has created A Team – a family of GenAI‑powered agents designed as accelerators, not replacements, across the full lifecycle of data projects.

The Challenge of Ensuring High-Quality Power BI Semantic Models
Blog Data Visualisation

The Challenge of Ensuring High-Quality Power BI Semantic Models

As Power BI adoption grows, so does the number of semantic models, and with it, the challenge of maintaining quality and consistency. Teams working on multiple projects often adopt different approaches to naming, design, DAX, and performance, leading to models that are harder to maintain and operate efficiently.

AI Governance – From Compliance Obligation to Competitive Advantage
Blog AI & Data Science

AI Governance – From Compliance Obligation to Competitive Advantage

Most organizations know they need to govern their AI. Fewer have turned that intention into a system that regulators, auditors, and business leaders can all trust.

From Locked Data to Governed Access: GxP-Aligned Data Access for Clinical & R&D Webinar
Tech Talks Data Strategy & Data Governance

From Locked Data to Governed Access: GxP-Aligned Data Access for Clinical & R&D Webinar

In this webinar, BI4ALL and Immuta show how to scale AI in one of the world's most regulated industries without drowning in tickets, manual approvals, and access-control chaos.

The Report is Correct, the Question is Wrong
Blog Data Visualisation

The Report is Correct, the Question is Wrong

It is easy to conflate three different discussions when talking about dashboards that do not deliver: productivity driven by AI, information design, and governance over who decides what is left out. These are distinct problems with distinct solutions. Solving only one of them is not enough, which is why this article addresses them in the right order.

Inside Saint-Gobain’s Data Maturity Framework Journey with BI4ALL
Tech Talks Data Strategy & Data Governance

Inside Saint-Gobain’s Data Maturity Framework Journey with BI4ALL

In this DAMA Portugal (Lisbon Chapter) webinar, Orquídea Fonseca (Data Strategy Lead, Saint-Gobain) and Sandro Scordo (Head of Data & AI Strategy and Governance, BI4ALL) share the story behind building an enterprise data maturity assessment across a decentralised, 80-country organisation.

video title

Lets Start

Got a question? Want to start a new project?
Contact us

Menu

  • Expertise
  • Knowledge Centre
  • About Us
  • Careers
  • Contacts

Newsletter

Keep up to date and drive success with innovation
Newsletter
PRR - Plano de Recuperação e Resiliência. Financiado pela União Europeia - NextGenerationEU

2026 All rights reserved

Privacy and Data Protection Policy Information Security Policy
URS - ISO 27001
URS - ISO 27701
Cookies Settings

BI4ALL may use cookies to memorise your login data, collect statistics to optimise the functionality of the website and to carry out marketing actions based on your interests.
You can customise the cookies used in .

Cookies options

These cookies are essential to provide services available on our website and to enable you to use certain features on our website. Without these cookies, we cannot provide certain services on our website.

These cookies are used to provide a more personalised experience on our website and to remember the choices you make when using our website.

These cookies are used to recognise visitors when they return to our website. This enables us to personalise the content of the website for you, greet you by name and remember your preferences (for example, your choice of language or region).

These cookies are used to protect the security of our website and your data. This includes cookies that are used to enable you to log into secure areas of our website.

These cookies are used to collect information to analyse traffic on our website and understand how visitors are using our website. For example, these cookies can measure factors such as time spent on the website or pages visited, which will allow us to understand how we can improve our website for users. The information collected through these measurement and performance cookies does not identify any individual visitor.

These cookies are used to deliver advertisements that are more relevant to you and your interests. They are also used to limit the number of times you see an advertisement and to help measure the effectiveness of an advertising campaign. They may be placed by us or by third parties with our permission. They remember that you have visited a website and this information is shared with other organisations, such as advertisers.

Política de Privacidade